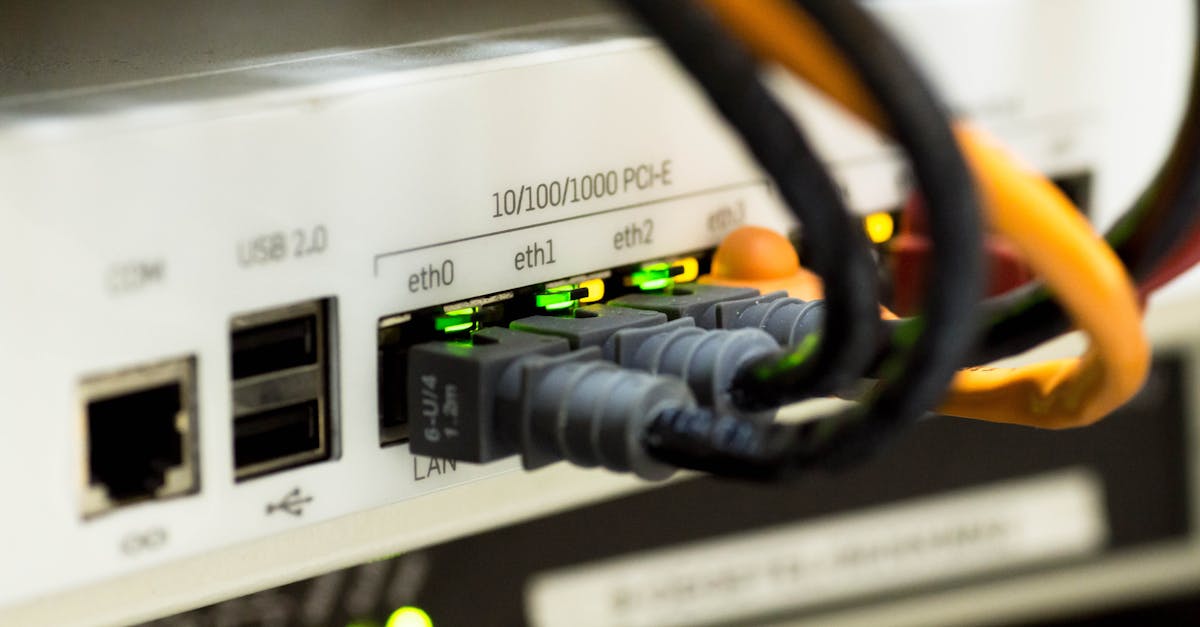
Living in a world where everything is connected, from our phones to our refrigerators, the idea of data usage is often abstract. We get a monthly bill or a notification that we’ve used ‘X’ gigabytes, and we either shrug or panic. But what does that number actually mean? I decided to find out, not just what I was told I was using, but what was truly passing through my home network. For 30 days, I meticulously tracked every byte of data traversing my internet connection, breaking it down by device and activity. What I discovered wasn’t just interesting; it was a wake-up call about how much data we unknowingly consume and where it’s really going.
Key Takeaways
- Streaming services are far more data-intensive than advertised, especially at higher resolutions.
- ‘Always-on’ smart home devices quietly consume significant background data, even when seemingly idle.
- Background updates and cloud syncing across multiple devices create a constant, often overlooked, data drain.
- Relying solely on ISP data reports can obscure the true sources and patterns of your internet consumption.
My Approach to Tracking Home Network Data
To get a genuinely accurate picture, I couldn’t just rely on my ISP’s usage meter, which provides a single, aggregated number. My goal was to see who and what was using the data. I started by investing in a router with advanced monitoring capabilities, specifically one that allowed per-device and per-application data usage tracking. Many consumer routers offer some basic traffic monitoring, but for this deep dive, I needed something more robust. I specifically chose a model that could run custom firmware, allowing me to install network analysis tools like OpenWRT with ntopng. This setup provided a detailed breakdown of inbound and outbound traffic, categorized by IP address, port, and even application signatures.
I created a spreadsheet and logged daily usage. Each night, I’d review the router’s logs, categorizing data by primary device (my work laptop, personal phone, smart TV, smart thermostat, security cameras, etc.) and by activity (streaming video, web browsing, gaming, software updates, cloud backups). This manual logging, while time-consuming, forced me to confront the numbers directly and observe patterns that automated reports might have smoothed over. The biggest hurdle was correctly attributing generic background traffic, which required cross-referencing with device activity logs or temporarily pausing services to see the network impact. What became immediately clear was that the ‘set it and forget it’ approach to smart devices meant a constant, low-level data hum I’d never considered.
The True Data Cost of Streaming is Higher Than Advertised
Before this experiment, I assumed a certain amount of data for streaming. Most services provide estimates: ‘HD streaming uses X GB per hour, 4K uses Y GB per hour.’ My experience revealed these are often optimistic at best, and misleading at worst. In my household, we primarily use two major streaming platforms, and we have a 4K TV. I always assumed 4K streaming would hit around 7-8 GB per hour, as commonly cited.
My actual measurements consistently showed 4K streaming consumption closer to 12-15 GB per hour on average, sometimes spiking higher during action-heavy scenes or at the beginning of a stream. This discrepancy became particularly apparent when comparing two different streaming platforms showing the same content in 4K – one might be at 10 GB/hr, the other at 14 GB/hr. The variation likely comes down to different encoding efficiencies and bitrates used by the services. A single two-hour 4K movie, watched by two people, could easily chew through 25-30 GB. Add a few shows and some background music streaming, and suddenly, a couple of evenings could account for a significant portion of a typical 200 GB data cap, if I had one.
The real insight here is that when a service advertises a data rate, it’s often an average or a minimum, not necessarily what your actual viewing experience will consume. If you’re on a data cap, this hidden ‘tax’ on high-quality streaming can be a brutal surprise. My recommendation is to assume a 50-100% higher data rate than advertised for 4K streaming if you want to avoid hitting your limits prematurely.
Smart Devices Aren’t So Smart About Data Consumption
I have a fairly typical collection of smart home devices: a smart thermostat, a few smart plugs, several smart light bulbs, and two security cameras (one indoor, one outdoor). I always believed these devices used negligible data, only connecting when actively commanded or when the cameras detected motion. My 30-day tracking told a very different story.
Even when idle, my smart thermostat generated a consistent 50-100 MB of data traffic per day. This wasn’t just when I adjusted the temperature via my phone; it was constant, background ‘heartbeat’ traffic checking for updates, reporting sensor data, and maintaining its cloud connection. Multiply that by 30 days, and a single ‘silent’ device accounts for 1.5-3 GB of data per month.
The security cameras were even more surprising. While their usage spiked dramatically when actively streaming or recording motion events (the outdoor camera, set to record 1080p, could easily use 2-3 GB per day with moderate activity), they also had a persistent background data draw. Even during periods of no motion, each camera averaged 200-300 MB per day of quiet, almost invisible communication with its cloud service. That’s another 6-9 GB per month per camera, just for being ‘ready.’
This background data usage adds up. If you have 10-15 smart devices, a conservative estimate of 100 MB per device per day puts you at an extra 30-45 GB of unacknowledged data usage per month. This isn’t data you’re ‘using’ in the traditional sense; it’s data your devices are consuming to simply exist on your network. If you’re struggling with data caps, examine your smart devices first, particularly those with constant cloud connections or embedded cameras, even when they seem idle.
The Invisible Drain of Background Processes and Syncing
Beyond active streaming and smart device heartbeats, a significant portion of my monthly data disappeared into what I categorize as ‘background noise.’ This includes software updates, cloud syncing for photos and documents, email fetching, and system diagnostics from various operating systems.
For example, my work laptop, even when primarily used for local document editing and light browsing, would sometimes initiate multi-gigabyte updates overnight for its operating system or major applications. These weren’t always announced, just a sudden spike in outbound traffic when I reviewed the logs. Over 30 days, my two laptops alone consumed about 20 GB just for system and application updates.
My personal phone, even with cellular data turned off at home, was a silent data guzzler. Photos and videos syncing to cloud storage, app updates, and background refreshes for dozens of applications added up. What I thought was a casual 10-minute scroll on social media was often preceded or followed by hundreds of megabytes of background data as the app refreshed feeds, downloaded cached content, and reported analytics. My phone consistently accounted for 15-20 GB per month of largely unacknowledged background traffic.
This category of data consumption is the hardest to control because it’s often essential for device functionality and security. However, becoming aware of it allows for better management. Scheduling large updates for off-peak hours or consciously managing cloud sync settings (e.g., only syncing photos when on a known unlimited network) can help mitigate unexpected data spikes. In my experience, ignoring these background processes is a surefire way to hit data limits without understanding why.
ISP Reports Don’t Tell the Whole Story
The biggest lesson from this 30-day experiment is that relying solely on your Internet Service Provider’s (ISP) reported data usage is like trying to understand your car’s fuel efficiency by only looking at the gas pump receipt. It tells you the total, but nothing about how it was used. My ISP report for the month showed a total usage of about 550 GB, which aligns broadly with my granular tracking of around 580 GB.
However, the ISP report offered zero insight into the composition of that data. It didn’t tell me that 45% came from 4K streaming, 15% from smart device background traffic, 10% from system updates, and the remaining 30% from a mix of web browsing, gaming, and other activities. Without this breakdown, it’s impossible to make informed decisions about managing consumption. If I suddenly found myself nearing a data cap, I’d have no idea whether to scale back streaming, check my security cameras, or simply wait for a large software update to finish.
This lack of transparency is a critical flaw. Many ISPs offer data usage tools, but they rarely provide the level of detail necessary for real insight. If you’re serious about understanding your internet usage, particularly if you have a data cap or are experiencing unexplained slowdowns, invest in a router with advanced monitoring features. It’s the only way to gain true visibility and control over your digital footprint. My 30 days of tracking proved that knowing the total isn’t enough; you need to know the components of that total to truly master your internet consumption.
Frequently Asked Questions
What kind of router do I need for detailed data tracking?
You’ll need a router that supports advanced traffic monitoring, often achieved by installing custom firmware like OpenWRT or pfSense, or by purchasing a prosumer/enterprise-grade router from brands like Ubiquiti or Netgear’s Nighthawk series with enhanced analytics. Look for features like per-device usage reports, application-level filtering, and real-time traffic graphs.
Is all background data usage from smart devices truly necessary?
Not always. While some background usage is for essential updates and cloud connectivity, often devices transmit more data than needed. Check the settings of your individual smart devices (apps, web portals). Some allow you to reduce telemetry, lower video streaming quality for monitoring, or adjust refresh rates for sensor data, which can significantly cut down on quiet consumption.
How accurate are in-app data usage meters for streaming services?
They can vary widely. My experience showed them to be often lower than actual network-level measurements. In-app meters might only count the main video stream and neglect associated data for ads, buffering, audio tracks, subtitles, or dynamic bitrate adjustments. For true accuracy, network-level monitoring at your router is the most reliable method.
Can my internet speed affect how much data I use?
Yes, indirectly. Faster internet speeds allow for higher-quality streams (e.g., 4K vs. HD) and quicker downloads of large files and updates, leading to higher overall data consumption if those capabilities are utilized. If you have a data cap, a very fast connection can allow you to hit that cap much faster than a slower connection would, simply because you’re able to consume high-bandwidth content more readily.
How can I reduce background data usage from my computers and phones?
For computers, disable automatic updates for non-critical software, set operating system updates to manual or scheduled times, and manage cloud sync settings (e.g., pause sync when not actively working on files). For phones, turn off ‘Background App Refresh’ for non-essential apps, manage photo/video cloud syncing to Wi-Fi only, and ensure apps aren’t set to automatically download large files.
My 30-day journey into the labyrinth of my home internet data was eye-opening. What I initially thought was a straightforward exercise in numbers quickly became a profound lesson in digital literacy. We live in an always-on, always-connected world, and our devices are constantly talking, often without our explicit knowledge or consent. Understanding these hidden data flows isn’t just about managing a data cap; it’s about gaining control over our digital lives. It empowers you to make smarter choices about your streaming habits, your smart home ecosystem, and even the software you install. Take the time to look under the hood of your home network, and you might be surprised by what your devices are really up to. The transparency you gain is invaluable for truly informed tech decisions.